

The Snellen chart is a tool used by eye care professionals to measure visual acuity—how clearly a person can see.
It was developed by Dutch ophthalmologist Herman Snellen in 1862.
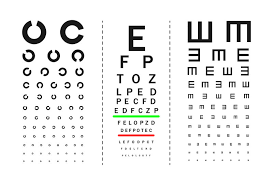
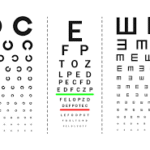
The Key features of a Snellen chart
The chart typically consists of 11 rows of capital letters (optotypes) that decrease in size from top to bottom.
The top letter is usually a large “E” and the letters get smaller in each subsequent row.
The chart is read from a standard distance of 6 meters (20 feet).Visual acuity is expressed as a fraction (e.g., 6/6 or 20/20), where the top number is the testing distance and the bottom number indicates the distance at which a person with normal vision could read the same line.
Purpose of the Snellen chart
- To diagnose vision problemsTo determine the need for glasses or further examination
- To monitor changes in vision over time.


Leave a Reply